function loadmarkethistory(priceIDs,regionID){
  if (typeof regionID == 'undefined'){
    regionID=10000002;
  }
  if (typeof priceIDs == 'undefined'){
    throw 'Need a list of typeids';
  }

  var prices = new Array();
  var dirtyTypeIds = new Array();
  var cleanTypeIds = new Array();
  var url="https://www.mokaam.dk/API/market/items?regionid="+regionID+"&typeid="

  priceIDs.forEach (function (row) {
    row.forEach ( function (cell) {
     if (typeof(cell) === 'number' ) {
        dirtyTypeIds.push(cell);
      }
    });
  });
  cleanTypeIds = dirtyTypeIds.filter(function(v,i,a) {
    return a.indexOf(v)===i;
  });

  prices.push([ 'TypeID',
                'Last updated',
                'Vol. yesterday',
                'Median vol. last week',
                'Median vol. last month',
                'Median vol. last quarter',
                'Median vol. last year',
                'Avg. price yesterday',
                'Median avg. price last week',
                'Median avg. price last month',
                'Median avg. price last quarter',
                'Median avg. price last year',
                'Order count yesterday',
                'Order count last week',
                'Order count last month',
                'Order count last quarter',
                'Order count last year',
                'Size yesterday',
                'Median size last week',
                'Median size last month',
                'Median size last quarter',
                'Median size last year',
                'Highest price yesterday',
                'Median highest price last week',
                'Median highest price last month',
                'Median highest price last quarter',
                'Median highest price last year',
                'Highest price yesterday',
                'Higest price last week',
                'Highest price last month',
                'Highest price last quarter',
                'Highest price last year',
                'Lowest price yesterday',
                'Median lowest price last week',
                'Median lowest price last month',
                'Median lowest price last quarter',
                'Median lowest price last year',
                'Lowest price yesterday',
                'Lowest price last week',
                'Lowest price last month',
                'Lowest price last quarter',
                'Lowest price last year',
                'Spread yesterday',
                'Median spread last week',
                'Median spread last month',
                'Median spread last quarter',
                'Median spread last year',
                'VWAP last week',
                'VWAP last month',
                'VWAP last quarter',
                'VWAP last year',
                '52 week low',
                '52 week high',
                'Std dev week',
                'Std dev month',
                'Std dev quarter',
                'Std dev year'])

  var parameters = {method : "get", payload : ""};

  var o,j,temparray,chunk = 100;
  for (o=0,j=cleanTypeIds.length; o < j; o+=chunk) {
    temparray = cleanTypeIds.slice(o,o+chunk);
    Utilities.sleep(100);
    var types=temparray.join(",").replace(/,$/,'')
    var jsonFeed = UrlFetchApp.fetch(url+types, parameters).getContentText();
    var json = JSON.parse(jsonFeed);
    if(json) {
      for(i in json) {
        var price=[parseInt(i),
                   json[i].last_data,
                   parseFloat(json[i].vol_yesterday),
                   parseFloat(json[i].vol_week),
                   parseFloat(json[i].vol_month),
                   parseFloat(json[i].vol_quarter),
                   parseFloat(json[i].vol_year),
                   parseFloat(json[i].avg_price_yesterday),
                   parseFloat(json[i].avg_price_week),
                   parseFloat(json[i].avg_price_month),
                   parseFloat(json[i].avg_price_quarter),
                   parseFloat(json[i].avg_price_year),
                   parseFloat(json[i].order_count_yesterday),
                   parseFloat(json[i].order_count_week),
                   parseFloat(json[i].order_count_month),
                   parseFloat(json[i].order_count_quarter),
                   parseFloat(json[i].order_count_year),
                   parseFloat(json[i].size_yesterday),
                   parseFloat(json[i].size_week),
                   parseFloat(json[i].size_month),
                   parseFloat(json[i].size_quarter),
                   parseFloat(json[i].size_year),
                   parseFloat(json[i].high_yesterday),
                   parseFloat(json[i].high_week),
                   parseFloat(json[i].high_month),
                   parseFloat(json[i].high_quarter),
                   parseFloat(json[i].high_year),
                   parseFloat(json[i].ab_high_yesterday),
                   parseFloat(json[i].ab_high_week),
                   parseFloat(json[i].ab_high_month),
                   parseFloat(json[i].ab_high_quarter),
                   parseFloat(json[i].ab_high_year),
                   parseFloat(json[i].low_yesterday),
                   parseFloat(json[i].low_week),
                   parseFloat(json[i].low_month),
                   parseFloat(json[i].low_quarter),
                   parseFloat(json[i].low_year),
                   parseFloat(json[i].ab_low_yesterday),
                   parseFloat(json[i].ab_low_week),
                   parseFloat(json[i].ab_low_month),
                   parseFloat(json[i].ab_low_quarter),
                   parseFloat(json[i].ab_low_year),
                   parseFloat(json[i].spread_yesterday),
                   parseFloat(json[i].spread_week),
                   parseFloat(json[i].spread_month),
                   parseFloat(json[i].spread_quarter),
                   parseFloat(json[i].spread_year),
                   parseFloat(json[i].vwap_week),
                   parseFloat(json[i].vwap_month),
                   parseFloat(json[i].vwap_quarter),
                   parseFloat(json[i].vwap_year),
                   parseFloat(json[i]._52w_low),
                   parseFloat(json[i]._52w_high),
                   parseFloat(json[i].std_dev_week),
                   parseFloat(json[i].std_dev_month),
                   parseFloat(json[i].std_dev_quarter),
                   parseFloat(json[i].std_dev_year)];
        prices.push(price);
      }
    }
  }
  return prices;
}
Mokaam's historic market data
This site is intended as a supplement to Adam4eve,
Fuzzwork, and the ESI from CCP.
It provides an easy way to pull data based on the historic market data in EVE online without making a query
for every item. Data is based on the market history endpoint from the ESI as well as the tracker and market history end points from the Adam4eve API
The API was made with the Oz community trading sheet in mind so the implementation is heavily based on how Fuzzwork implements his API in Google Sheet.
The Oz community sheet can be found on Oz's discord under #faq.
It is a project created as a learning experience for myself and is running on my own server, so if the response times are slow or the site doesn't work,
the reason
can be the hardware, the code, or anything in between and is most likely due to n00bishness from my side.
Huge thanks to Steve from Fuzzwork, Ethan from Adam4eve, as well as Shikkoken and Bonsailinse from the Oz community for invaluable help, discussions,
and advice.
Also Big thanks to Phaelim O'Neil (Lanarion on discord) from the trading community on Oz's discord, for writing the guide on calling the API from Excel
and creating the examples.
Important Info for people using the ../orders endpoint
I have deactivated the ../orders endpoint as it was causing too much confusion and it was providing unreliable data due to several reasons, mainly the source of the data.
The source was the Adam4Eve statics, which are not always complete, combined with the fact that this data is in its very essence estimates rather than actual trades. There might also be something on my end but since the endpoint is based on estimates and also very likely would require Ethan from Adam4Eve to dive into this I will not pursue it.
The endpoint came about in the dark times when the ESI market history endpoint was gone and there is no real reason to use it anymore.
How to format calls
MAKE SURE YOUR APPS USE THE API PROPERLY!
FORMAT REQUESTS WITH COMMA SEPARATED TYPEIDS - DONT MAKE A REQUEST FOR EACH INDIVIDUALLY!
I will block User Agents and IP addresses if they hit my server too hard. If you get the status code 403 instead of 200 contact Mokaam on Oz's discord or in game Mokaam Racor
If you're scraping the entire database for a region, use the "all" end point
After PLEX has been moved to a global market it is now implemented in two ways: it is available on the global regionid 19000001 and all other regionids now also pull the PLEX data from that global regionid. So e.g. if you use The Forge it will still return data for PLEX but now that data is pulled from the global regionid
There are currently 10 regions available for the ESI data:
Global Market with regionid: 19000001 (only PLEX with itemid 44992 is available here)
The Forge with region id: 10000002
Domain with region id: 10000043
Lonetrek with region id: 10000016
Sinq Laison with region id: 10000032
Delve with region id: 10000060
Perrigen Falls with regionid: 10000066
Metropolis with region id: 10000042
Heimatar with region id: 10000030
Vale of the Silent with region id: 10000003
Fountain with region id: 10000058
and 3 regions available for the A4E data:
The Forge with region id: 10000002
Sinq Laison with region id: 10000032
Domain with region id: 10000043
Requests can be formated to call data for one or more items from a region:
https://mokaam.dk/API/market/items?regionid=10000002&typeid=34,35
Requests can be formated to call all data from a region. Be carefull not to use this call in Google Sheet as it will return too much data for Google Sheet to handle
https://mokaam.dk/API/market/all?regionid=10000002
You can get all the type ids with names for each id that I serve data for with this request (Data is only updated once per week so no need to pull every time your sheet changes):
https://mokaam.dk/API/market/type_ids
Requests can be formatted to query the database with a pseudo SQL query.
The syntax is a bit weird to make it all work:
- type is "items"
- You can use logical and, or, etc as well as brackets and other things you usually find in an SQL query
- Use "-" instead of space in the query
I have made a sample sheet you can download here that shows how it can be used with a button (the script is in the script editor)
https://mokaam.dk/API/market/query?type=items®ionid=10000002&query=size_month>15000000000-and-vol_month>500
Data returned from API:
Based on the data from the ESI market history end point. The data the statistics are calculated on are actual
trades performed. If no price data was found for a specific type id on a specific day in a specific region, values from the day before is used. Sometimes data is missing on days from the raw data from the ESI. In those cases values are found using interpolation. Due to the
restrictions from CCP on the rate at which data can be acquired, the process of updating the 10 regions will take hours.
Update starts @ 12.05 p.m. UTC and during the update you can experience an error if you try to request data. Just wait 10 min and try again. If the problem persists or it is not within the timeframe indicated here, please let me know.
| typeid: | Typeid of the item |
|---|---|
| last_data: | Last time CCP data was updated, returns date of the newest entry, "Null" if no data from market, "Itemid not found" or "ERROR: {error_code}" if update from CCP gave an error |
| vol_{time}: | Median volume of trades on the market for {time} = yesterday, last week, month, quarter, or year respectively |
| avg_price_{time}: | Median average price for trades for {time} = yesterday, last week, month, quarter, or year respectively |
| order_count_{time}: | Median number of orders fulfilled for {time} = yesterday, last week, month, quarter, or year respectively |
| size_{time}: | Median size of market
$$Size = Price_{avg} ⋅ Volume$$ for {time} = yesterday, last week, month, quarter, or year respectively |
| high_{time}: | Median highest price traded for {time} = yesterday, last week, month, quarter, or year respectively |
| ab_high_{time}: | Highest traded price within 4 standard deviations for {time} = yesterday, last week, month, quarter, or year respectively |
| low_{time}: | Median lowest price traded for {time} = yesterday, last week, month, quarter, or year respectively |
| ab_low_{time}: | Lowest traded price within 4 standard deviations for {time} = yesterday, last week, month, quarter, or year respectively |
| spread_{time}: | Median spread of trades on the market for {time} = yesterday, last week, month, quarter, or year respectively |
| vwap_{time}: | Volume weighted average price for {time} = last week, month, quarter, or year respectively Calculated as:
$$VWAP = {∑↙{today}↖{time}Volume ⋅ Price_{avg}}/{∑↙{today}↖{time}Volume}$$ |
| _52w_{high/low}: | 52 week highest or lowest average price traded respectively |
| std_dev_{time}: | Standard deviation on average traded price for {time} = last week, month, quarter, or year respectively |
How to call the API in Google Sheet
The API is called in Google Sheet in the same way as Fuzzwork calls his. Below is a script function to implement in Google Sheet to pull data. I highly suggest to only parse the data you need into Google Sheet
How to call the API in Excel
The API is called from Excel by using Power Query. It requires either Excel 365 or PowerBI for the following guide to work.
I will use an example so all codes should be modified with your own cells, names and ranges.
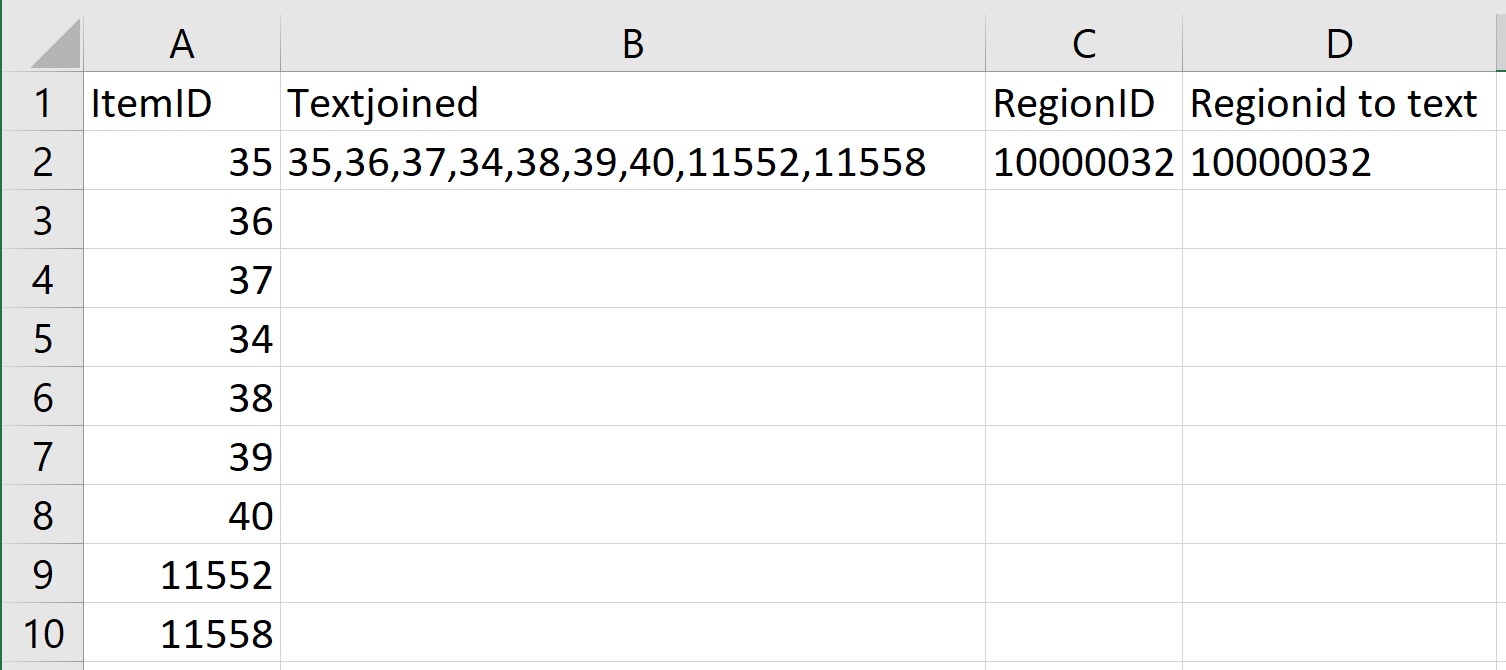
Before we get started a few steps has to be done in Excel to ready the data for Power Query. First create a column with itemids (or use the one you have in your current sheet) and a cell with the regionid of the region to get data from.
Then in a new cell join the itemids:
=TEXTJOIN(",",TRUE,!A2:A10)
This returns a concatenated, comma seperated text string that represents all the itemids.
Now either format the cell with the regionid as text or create a new cell to convert the regionid from a number to text by using:
=TEXT(C2,0)

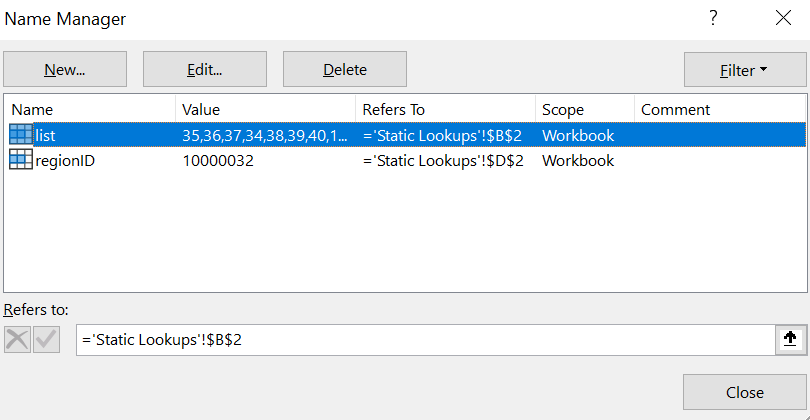
Define a name for the joined itemids and the regionid in the Name Manager. Go to Name Manager in the "Formula" tab. Press "New" and add the cells with
the joined text and the regionid with each their name. I named my itemids "list" and my regionid "regionID".


From the "Data" tab choose "From Web" and enter the following URL into the URL field and press "OK":
https://mokaam.dk/API/market/items?regionid=10000002&typeid=4

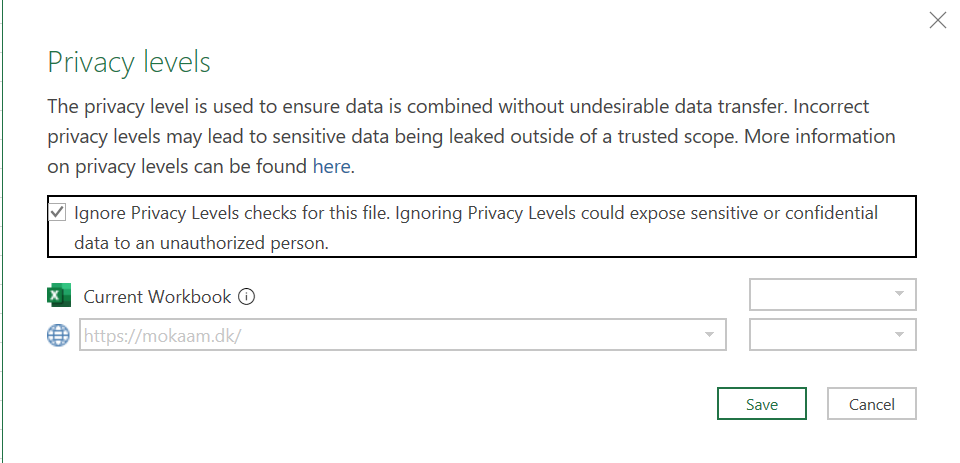
This should open the Power Query Editor, if it doesn't open, click "Queries & Connections" and double click the query. In the Power Query Editor you
might have a warning about privacy, Click "Continue" and check "Ignore Privacy Levels.." and press "Save".


Go to the "Home" tab of the Power Query Editor and choose "Advanced Editor".

Replace all code with the following and click "Done" and then click "Close & Load" under the "Home" tab in the Power Query Editor.